This is the sixth part of the Custom memory allocation series. For your convenience you can find other parts in the table of contents in Part 1 — Allocating object on a stack
We already know how to allocate object in any place in memory. We can invoke constructor for already created object. We know how to hijack new operator and dispatch allocations to our code. We can parse lambda and have compile time support for unsafe allocations. Unfortunately, we have another thing: problems.
Table of Contents
The code
I will describe some problems with our mechanisms using the following code:
|
1 2 3 4 5 6 7 8 9 10 11 12 13 14 15 16 17 18 19 20 21 22 23 24 25 26 27 28 29 30 31 32 33 34 35 36 37 38 39 40 41 42 43 44 45 46 47 48 49 50 51 52 53 54 55 56 57 58 59 60 61 62 63 64 65 66 67 68 69 70 71 72 73 74 75 76 77 78 79 80 81 82 83 84 85 86 87 88 89 90 91 92 93 94 95 96 97 98 99 100 101 102 103 104 105 106 107 108 109 110 111 112 113 114 115 116 117 118 119 120 121 122 123 124 125 126 127 128 129 130 131 132 133 134 135 136 137 138 139 140 141 142 143 144 145 146 147 148 149 150 151 152 153 154 155 156 157 158 159 160 161 162 163 164 165 166 167 168 169 170 171 172 173 174 175 176 |
using CustomMemoryAllocator; using CustomStackAllocator; using System; using System.Linq.Expressions; namespace Demo { public struct Simple { public int X, Y, Z; public override string ToString() { return $"{X} {Y} {Z}"; } } public enum Direction { North = 1, South = 2 } public class BaseDummy { public BaseDummy() { Console.WriteLine("Creating base"); } ~BaseDummy() { Console.WriteLine("Deleting base"); } } public class VerySimple { public int Integer; public double Double; public float Float; public short Short; public long Long; public byte Byte; public bool Bool; public Simple ValueType; public Simple BoxedValueType; public object ReferenceType; public Direction Enum; public VerySimple(int @int, double @double, float @float, short @short, long @long, byte @byte, bool @bool, Simple valueType, object referenceType, Direction @enum, object boxedValueType) { Console.WriteLine("Creating VerySimple at: " + AllocationHelper.GetAddress(this)); Integer = @int; Double = @double; Float = @float; Short = @short; Long = @long; Byte = @byte; Bool = @bool; ValueType = valueType; ReferenceType = referenceType; Enum = @enum; BoxedValueType = (Simple)boxedValueType; } public override string ToString() { return $"{Integer} {Double} {Float} {Short} {Long} {Byte} {Bool} {ValueType} {ReferenceType} {Enum} {BoxedValueType}"; } public void Dispose() { Console.WriteLine("Disposing"); } } class Dummy : BaseDummy, IDisposable { public int Integer; public double Double; public float Float; public short Short; public long Long; public byte Byte; public bool Bool; public Simple ValueType; public Simple BoxedValueType; public object ReferenceType; public Direction Enum; public Dummy(int @int, double @double, float @float, short @short, long @long, byte @byte, bool @bool, Simple valueType, object referenceType, Direction @enum, object boxedValueType) { Console.WriteLine("Creating child at: " + AllocationHelper.GetAddress(this)); Integer = @int; Double = @double; Float = @float; Short = @short; Long = @long; Byte = @byte; Bool = @bool; ValueType = valueType; ReferenceType = referenceType; Enum = @enum; BoxedValueType = (Simple)boxedValueType; } public override string ToString() { return $"{Integer} {Double} {Float} {Short} {Long} {Byte} {Bool} {ValueType} {ReferenceType} {Enum} {BoxedValueType}"; } public void Dispose() { Console.WriteLine("Disposing"); } } class Program { static void Present(object dummy) { lock (dummy) { Console.WriteLine($"Generation: {GC.GetGeneration(dummy)}"); Console.WriteLine($"Object: {dummy}"); } } static void Main(string[] args) { using (IAllocator allocator = new BasicHeapAllocator(100000)) { Expression< Func< Dummy>> lambda = () => new Dummy(15, 30.0, (float)45.5, 60, 75, 90, true, new Simple { X = 12, Y = 23, Z = 34 }, "String", Direction.North, new Simple { X = 22, Y = 33, Z = 88 }); var o = allocator.Alloc(lambda); Present(o); allocator.Free(o); } using (IAllocator allocator = new BasicHeapAllocator(100000)) { AllocationHelper.PatchNew(allocator); var o = new VerySimple(1, 2.0, 3, 4, 5, 6, true, new Simple { X = 7, Y = 8, Z = 9 }, "New String", Direction.North, new Simple { X = 10, Y = 11, Z = 12 }); AllocationHelper.RestoreNew(); Present(o); allocator.Free(o); } using (BasicStackAllocator allocator = new BasicStackAllocator()) { Expression< Func< Dummy>> lambda = () => new Dummy(-3, -7.0, (float)-11.23, -5, -9, 5, true, new Simple { X = 2, Y = 3, Z = 4 }, null, Direction.South, new Simple { X = -5, Y = -4, Z = -7 }); unsafe { var o = allocator.Alloc(lambda); Present(o); allocator.Free(o); } } } } } |
The code is long by design. I wanted to test passing multiple parameters with different types and verify different allocators. And here are the conclusions.
Simple allocation on a heap
Ordinary allocation on a heap works pretty stable. As you can see, I was able to allocate object with multiple parameters, I could use finalizer, and inherit from other class. However, this was the only one stable method.
Problems with hijacking new
When we examined the new operator we hijacked only one of its implementations. Unfortunately, there are others which we should patch as well. Let’s see the problematic code:
|
1 2 3 4 5 6 7 8 |
using (IAllocator allocator = new BasicHeapAllocator(100000)) { AllocationHelper.PatchNew(allocator); var o = new VerySimple(1, 2.0, 3, 4, 5, 6, true, new Simple { X = 7, Y = 8, Z = 9 }, "New String", Direction.North, new Simple { X = 10, Y = 11, Z = 12 }); AllocationHelper.RestoreNew(); Present(o); allocator.Free(o); } |
We patch operator to direct it to our custom allocator. Next, we create an object with multiple parameters, and restores operator. This works as designed, however, if we replace VerySimple with Dummy it breaks in the Free method because allocator says that it didn’t allocate this object. Why? Because Dummy inherits from something different then System.Object. Because of different allocation mechanisms, allocator only handles call to base class allocation, not to the derived class.
Problems with allocating on a stack
Allocation on a stack looks pretty easy. We have the following code:
|
1 2 3 4 5 6 7 8 9 10 |
using (BasicStackAllocator allocator = new BasicStackAllocator()) { Expression< Func< Dummy>> lambda = () => new Dummy(-3, -7.0, (float)-11.23, -5, -9, 5, true, new Simple { X = 2, Y = 3, Z = 4 }, null, Direction.South, new Simple { X = -5, Y = -4, Z = -7 }); unsafe { var o = allocator.Alloc(lambda); Present(o); allocator.Free(o); } } |
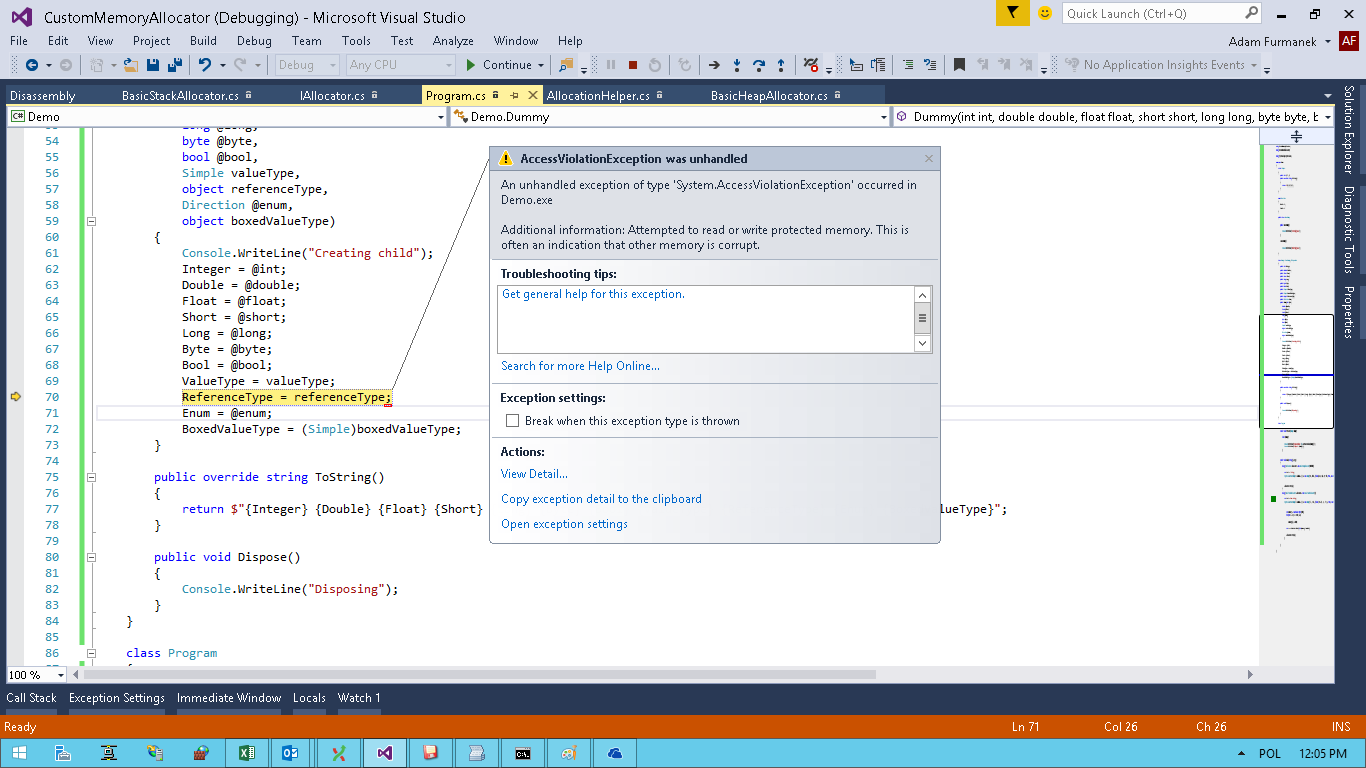
Observe, that we are passing null to reference type. If we now replace it with something else (string for instance), we get the following error:
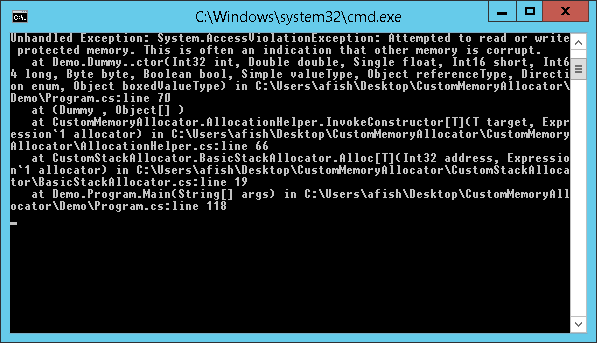
It looks pretty strange. If you debug the code you will see that the exception is thrown in this line in constructor:
|
1 |
ReferenceType = referenceType; |
Well, looks bad. But if we try to read or write values using Immediate Window we will have no errors. Well, what can be wrong? Let’s debug the machine code:
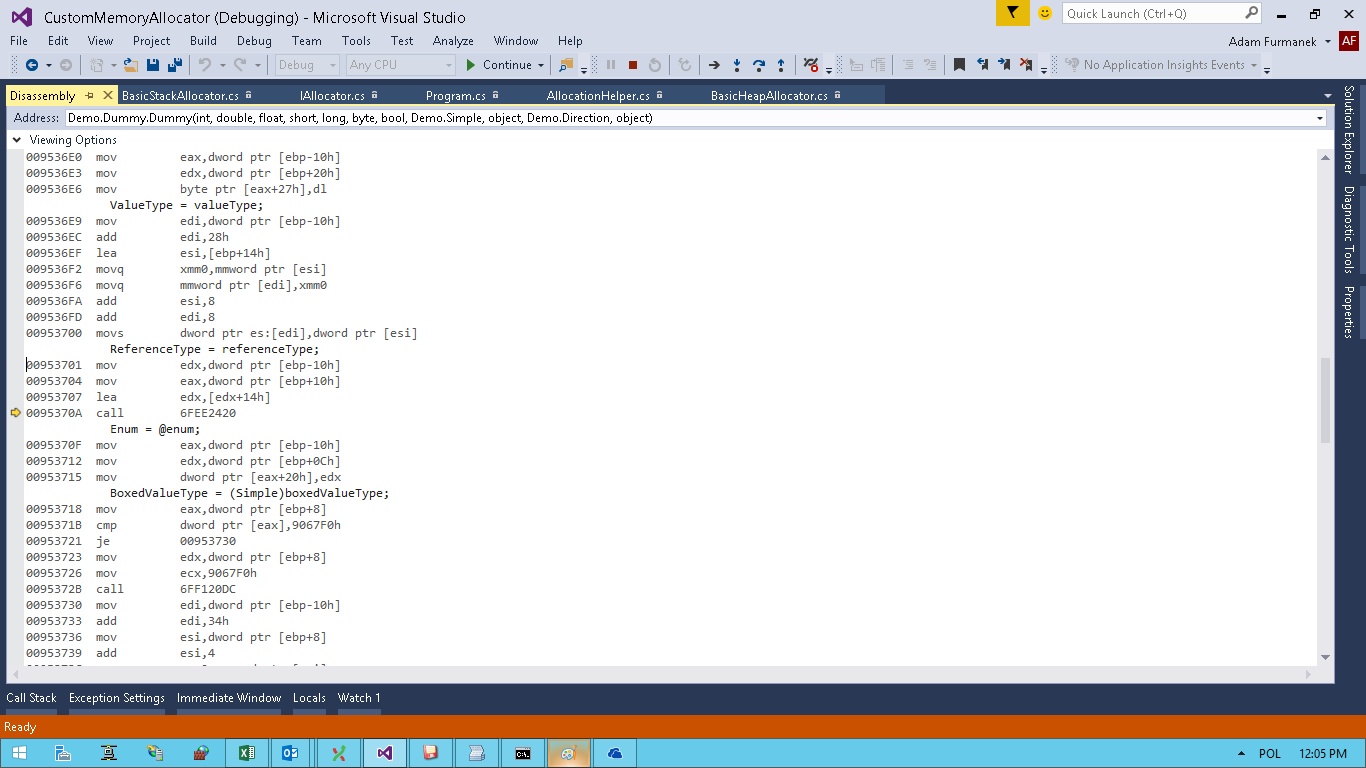
What is going on here? This is the call to call clr!JIT_WriteBarrierEAX method. I am not going to describe here what are memory barriers, but there is one important thing inside their implementation in .NET. Inside a write barrier, a check is made to see whether the object being assigned to has an address lower that the start address of generation 1 (i.e., generation 1 or 2). In that case .NET updates some addresses to obtain lock on an address. Since lock must be made on a specific segment address, .NET simply performs some bitwise operations on the address of written object and modify memory there — but this memory might not be mapped to our process. Unfortunately, when you try to access memory on a stack, you must be careful. 1 out of 20 executions had no error because of address randomization.
Patching new once again
When we were implementing new hijacking, we were manually attaching debugger to our application and we couldn’t start it using F5. This is another reason to not do that — if we cannot debug application, we are screwed. Of course, we could try to come up with different patching mechanism and detected in runtime whether we have debugger connected or not, but then we would probably hit other errors.
Summary
Messing with memory is funny. We were able to implement multiple different scenarios and handle pretty nice cases. However, memory issues are hard to debug and this is why .NET relies on GC implementation. If we need to perform these dirty hacks maybe we should just take different language?